
Know where your practice stands. Decide with confidence.
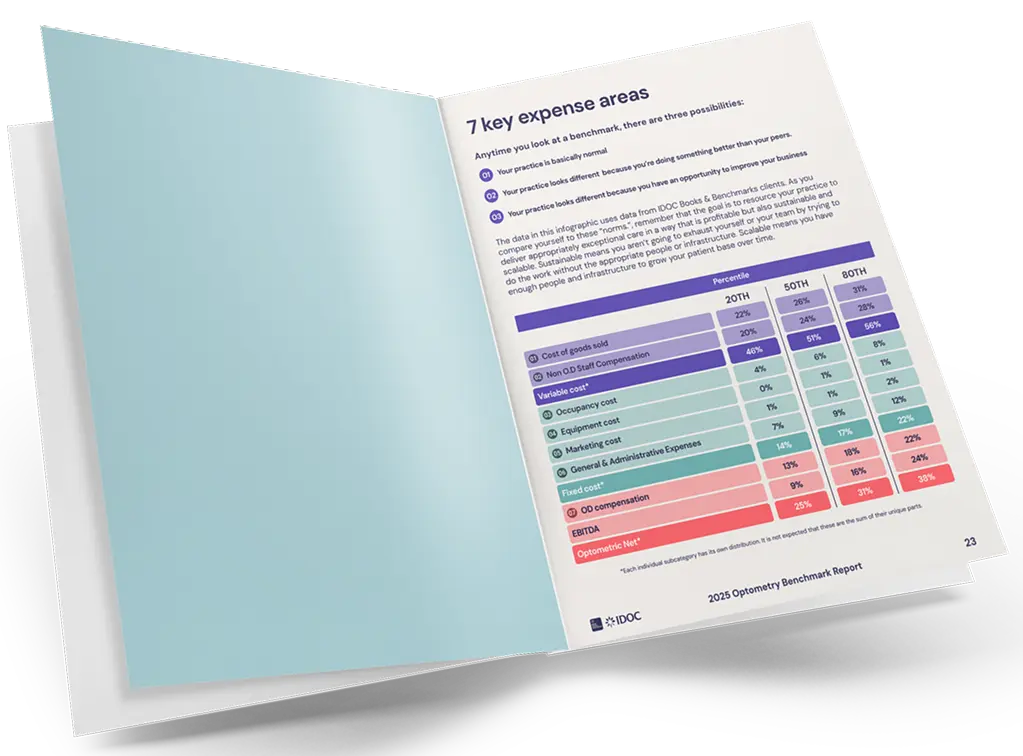
Stop guessing how you compare. In our annual optometry industry report, you’ll find benchmarks for revenue, staffing, costs, overhead, and profitability. Use it to understand where your practice falls, where investment may be needed and what to plan for next.
The numbers behind stronger practices
What the report is
This report gives you a clear view of how your financial performance compares to other practices.
We built our report from real Books & Benchmarks data from independent practices across the country, so you see the benchmarks and trends that matter most.
Why it matters to your practice
Your financials should do more than tell you what happened last month. With this report, you can see how you compare, spot areas worth a closer look, and make more confident decisions about profitability, payroll, and what's next.
Who the report is for
If you're part of an independent optometry practice, this report is for you.
Owners, optometrists, office managers, opticians, and practice leaders get benchmarks they can act on. Educators and students also get a clear picture of the financial realities behind independent practice.
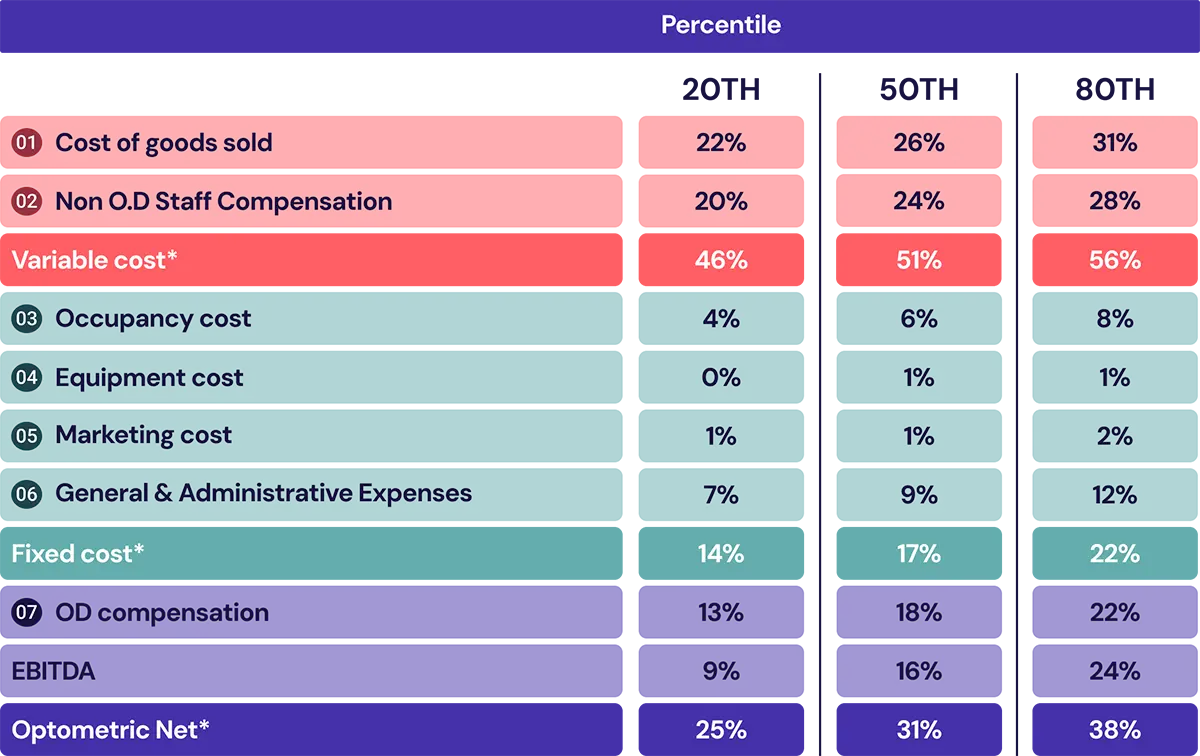
7 key expense areas of optometry
In this report, you'll find:
- Variable costs: benchmarks for COGS and non-OD staff pay, plus how to manage both
- Fixed costs: benchmarks for occupancy, equipment, marketing, and G&A
- OD compensation: what practices spend on doctor pay and how to gauge efficiency
- The big picture: ranges for all seven areas and what changed in 2025
Ready for a clearer picture of your financials?
Find out how IDOC Books & Benchmarks delivers accurate, timely financials and peer benchmarks.